Hourly labour cost highest in Norway 2012
In 2012, the highest labour cost for all economic activities (excluding agriculture and public administration) in Europe was in Norway, EUR 57.1 per paid hour. The labour cost was lowest in Bulgaria, EUR 3.4. Comparison between the European countries can be found in Figure 1. The hourly labour cost in the European Union (EU28) was EUR 24.1 on average, which was a little higher than in Iceland where it was EUR 23.2. In general, the countries in Eastern and Southeast Europe had the lowest labour cost measured in Euros.
The difference between countries narrows considerably when labour cost are compared in purchasing power standards (PPS), a measure which accounts for price differentials across countries. The most proportional change from Euro to PPS was in Macedonia, where the PPS value was 150% higher than labour cost measured in Euros. In Iceland the change was relatively smaller in PPS terms, approximately 11% lower than in Euros. In PPS terms the hourly labour cost recorded in Iceland was PPS 20.7 whereas the average value in the EU28 countries was PPS 23.4 in 2012.
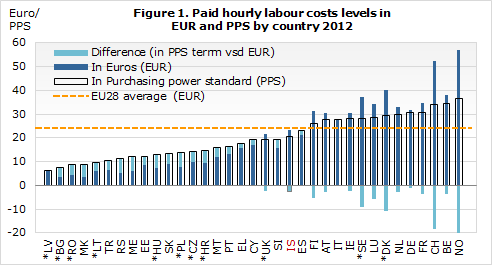
Notes: The figures for hourly labour cost do not include apprentices. List of countries and codes can be seen here. Country code marked as * are part of the EU but had a national currency in 2012.
The labour cost in PPS terms was highest in Norway, PPS 36.6, which is around six times the labour cost per paid hour in Latvia, where it was PPS 6.3. In PPS terms the hourly labour cost recorded in Norway and Switzerland was similar to what was measured in the EU.
Exchange rate leverage when comparing labour cost
From 2008 to 2012 the hourly labour cost has changed in most countries in Europe, both in Euro and national currencies (NAC) as demonstrated in Figure 2. In Latvia and Cyprus the changes were minor while hourly labour cost increased by 33.6% in Bulgaria.
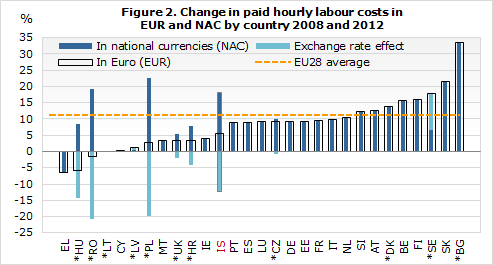
Notes: List of countries and codes can be seen here. Country code marked as * are part of the EU but had a national currency in 2012.
The exchange rate effect of the Swedish Krona (SEK) to Euro caused an increase of 17.8% in the hourly labour cost in Euro while the increase was 6.6% in SEK. The effect of exchange rate was very little both in Denmark and Lithuania but the currency depreciated against the EUR for other countries with their own national currency (NAC). The effect was greatest in Rumania, 20.8 percentage points, Poland 19.7 and Hungary 14.2.
Between 2008 and 2012 the labour cost in Iceland rose by 18.0% in Icelandic Kronas (ISK), but the cost in Euros increased by 5.6%, the impact of the exchange rate being 12.4 percentage points. In 2008 the exchange value of ISK/EUR was 143.83 ISK whereas the exchange rate in 2012 was 160.73 ISK. It should be noted that the mid exchange rate of the Central Bank of Iceland (CBI) in 2008 was 127.46 ISK which is considerably lower than the rate used in the results published by Eurostat. If the CBI rate is used the increase in the Icelandic labour cost between 2008 and 2012 was 6.4%.
About the Labour Cost Survey
Above-mentioned figures are from a publication issued on the 15th of December 2014 by the Statistical Office of the European Union (Eurostat) and are based on the results of the 2012 edition of the four-yearly Labour Cost Survey (LCS).
The LCS provides details on the level and structure of labour cost data, hours worked and hours paid for employees, both full-time and part-time. Above-mentioned figures exclude apprentice and the economic activities of agriculture, forestry and fishing and public administration.
Total Labour Costs refer to the total expenditure of employers in order to employ staff. It covers wage and nonwage costs less subsidies, including vocational training costs or other expenditures such
as recruitment costs, spending on working clothes, etc. More detailed statistics explained articles are available on the Eurostat website: "Labour cost structural statistics - levels" and "Labour cost structural statistics - changes". Entire results from the survey are available on Eurostat website.