According to the Icelandic Labour Force Survey the number of persons in the labour force in November 2013 was 182,600. Of those in the labour force 175,000 persons where employed and 7,700 persons where unemployed. The activity rate was 79.9%, the employment rate was 76.5% and the unemployment rate was 4.2%. Comparison between November 2012 and 2013 shows that activity rate has increased by 2.7 percentage points, employment rate has increased by 2.6 percentage points and unemployment rate relatively the same.
Figure 1. Labour force November 2013
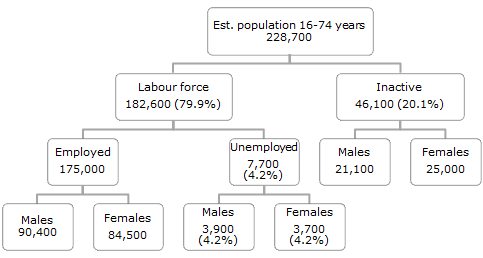
Figures may not add up because of rounding.
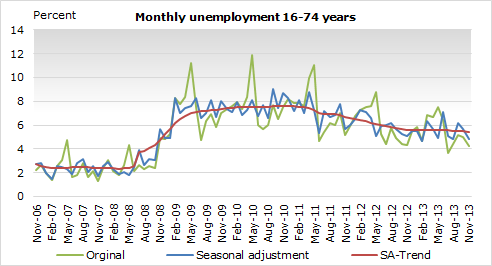
Seasonally adjusted unemployment 4.8%
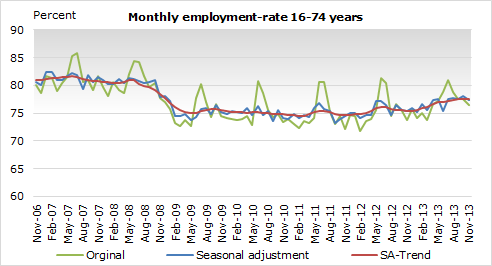
The seasonally adjusted data shows that in November 2013 the number of people in the labour force was 187,800 or 81.4% activity rate compared to 82.8% in October. The number of unemployed persons amounted to 9.100 and decreased by 1,600 between October and November. The unemployment rate was 4.8% in November compared to 5.6% in October. According to the seasonal adjustment the number of employed persons in November was 178,700 compared to 178,100 in October.
The seasonally adjusted trend data shows that for the last six months the labour force has increased by 1.7% and the activity rate by 0.3 points. Unemployment for the last six months has slightly decreased or by 1.2% and the rate by 0.2 points. The trend shows that number of employed persons has increased by 1.9%.
The twelve month trend for activity has increased by 4%, employment has increased by 4.1%, inactive has decreased by 9% and unemployment has decreased by 1%.
Implementation
November 2013 is divided in to four weeks, from the 4th of November to 1st of December 2013. The total sample size was 1,203 persons, 16–74 years randomly chosen from the Population Register. When those who had passed away or those who were living abroad had been deducted from the sample the net sample was 1,171 persons. In total the number of usable answers was 928 which corresponds to 79.2% response rate. All figures have been weighted by sex and age groups. The confidence limit of the results on activity rate is ±2.5 points, employment rate is ±2.6% and unemployment rate is ±1.4%. Figures may not add up because of rounding. All numbers for the first two months of each quarter are preliminary numbers until the quarter ends. That goes for November and November in this quarter.
| Table 1. Labour market in November - Original | ||||||
| CI | CI | CI | ||||
| 2011 | (±95%) | 2012 | (±95%) | 2013 | (±95%) | |
| Total 16-74 years | ||||||
| Activity rate | 76.1 | 2.6 | 77.2 | 2.4 | 79.9 | 2.5 |
| Employment rate | 72.2 | 2.8 | 73.9 | 2.5 | 76.5 | 2.6 |
| Unemployment rate | 5.1 | 1.5 | 4.3 | 1.3 | 4.2 | 1.4 |
| Hours of work | 40.7 | 1.3 | 39.3 | 1.1 | 40.1 | 1.2 |
| Labour force | 170,400 | 5,900 | 173,300 | 5,300 | 182,600 | 5,700 |
| Employed | 161,600 | 6,200 | 165,800 | 5,600 | 175,000 | 6,000 |
| Unemployed | 8,700 | 2,600 | 7,500 | 2,300 | 7,700 | 2,600 |
| Inactive | 53,600 | 5,900 | 51,200 | 5,300 | 46,100 | 5,700 |
| Est. population | 224,000 | • | 224,500 | • | 228,700 | • |
| Table 2. Labour market last 6 months - Seasonal adjustment | ||||||
| Jun-13 | Jul-13 | Aug-13 | Sep-13 | Oct-13 | Nov-13 | |
| Total 16-74 years | ||||||
| Activity rate | 81.1 | 81.6 | 81.7 | 82.7 | 82.8 | 81.4 |
| Employment rate | 75.3 | 77.5 | 77.7 | 77.6 | 78.1 | 77.4 |
| Unemployment rate | 7.1 | 5.0 | 4.9 | 6.2 | 5.6 | 4.8 |
| Hours of work | 40.5 | 40.2 | 39.7 | 41.0 | 39.3 | 39.9 |
| Labour force | 184,900 | 183,700 | 185,700 | 189,200 | 188,800 | 187,800 |
| Employed | 171,800 | 174,500 | 176,700 | 177,600 | 178,100 | 178,700 |
| Unemployed | 13,100 | 9,300 | 9,000 | 11,600 | 10,700 | 9,100 |
| Inactive | 43,200 | 41,400 | 41,600 | 39,500 | 39,300 | 43,000 |
| Est. population | 228,100 | 225,100 | 227,300 | 228,700 | 228,100 | 230,800 |
| Table 3. Labour market last 6 months - Seasonal adjustment trend | ||||||
| Jun-13 | Jul-13 | Aug-13 | Sep-13 | Oct-13 | Nov-13 | |
| Total 16-74 years | ||||||
| Activity rate | 81.7 | 81.7 | 81.9 | 82.0 | 82.0 | 82.0 |
| Employment rate | 77.1 | 77.2 | 77.4 | 77.5 | 77.6 | 77.5 |
| Unemployment rate | 5.6 | 5.6 | 5.5 | 5.5 | 5.5 | 5.4 |
| Hours of work | 39.8 | 39.8 | 39.8 | 39.8 | 39.8 | 39.8 |
| Labour force | 184,400 | 185,200 | 186,300 | 187,300 | 187,600 | 187,600 |
| Employed | 174,000 | 174,900 | 176,100 | 177,000 | 177,300 | 177,400 |
| Unemployed | 10,300 | 10,300 | 10,200 | 10,300 | 10,300 | 10,200 |
| Inactive | 41,400 | 41,400 | 41,200 | 41,000 | 41,100 | 41,200 |
| Est. population | 225,800 | 226,500 | 227,500 | 228,300 | 228,600 | 228,800 |